How to Determine If It’s a Seller’s or Buyer’s Market
Posted on December 14, 2017 by Laura Lucky
With all the news reports discussing how the local real estate market is faring, we thought it was important to reiterate that the markets behave quite differently from one another depending on area of the Valley, price point, dwelling type and more. Are we in a seller’s market? A buyer’s market? Are homes selling with multiple offers and over list price? Or are buyers able to dominate the negotiations in a sales transaction? Yes, yes, yes and yes! It just depends on what type of market we’re talking about.
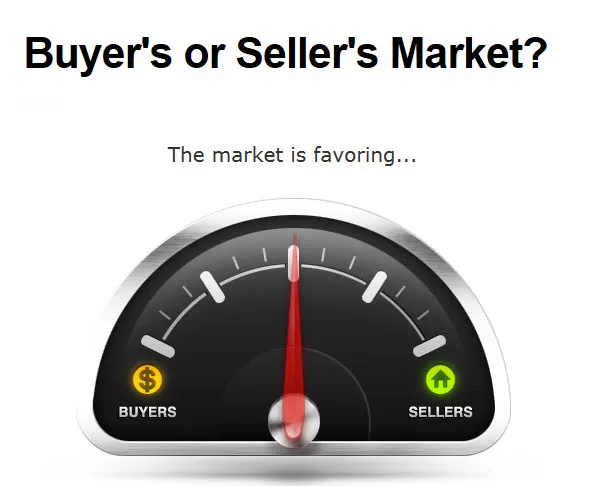
One of the best ways to determine the “hotness” of a market is with the Active/Pending Ratio. When we analyze the number of properties for sale along with the number of properties that are under contract, we come up with a ratio that tells us if that segment of the market favors sellers, buyers or is neutral.
A market with a ratio of 50% is a pretty normal market. It favors buyers and sellers about equally. A ratio under 50% tells us it’s tending to a buyer’s market – that there are many more homes on the market than what are currently selling. Conversely, a ratio above 50% shows that there are more buyers than homes available – the perfect example of a seller’s market.
We thought we’d show you some examples of micro markets around the Valley: Any single-family property in Maricopa County priced under $150,000 is currently at a ratio of 139%. They are selling quickly, and are often sold above list price. That’s a hot seller’s market! Homes in Maricopa County priced above $3,000,000 have a ratio of 6%. Clearly, there is a larger supply than there is demand.
Let’s see how some North Scottsdale zip codes compare:
85255
Single-Family Homes: 19%
Multi-Family Homes: 32%
Homes priced under $500K: 46%
Homes priced $500K-$999K: 22%
Homes priced $1M-$1,999K: 15%
Homes priced $2M+: 11%
85262
Single-Family Homes: 17%
Multi-Family Homes: 21%
Homes priced under $500K: 35%
Homes priced $500K-$999K: 27%
Homes priced $1M-$1,999K: 8%
Homes priced $2M+: 7%
85266
Single-Family Homes: 23%
Multi-Family Homes: 33%
Homes priced under $500K: 32%
Homes priced $500K-$999K: 21%
Homes priced $1M-$1,999K: 18%
Homes priced $2M+: 13%
Contact us with questions. We know the market’s ins-and-outs and can help you succeed whether you’re buying or selling!
602.320.8415 or lucky@russlyon.com


